Download our e-book of Introduction To Python
Related Blog
Matplotlib - Subplot2grid() FunctionDiscuss Microsoft Cognitive ToolkitMatplotlib - Working with ImagesMatplotlib - PyLab moduleMatplotlib - Working With TextMatplotlib - Setting Ticks and Tick LabelsCNTK - Creating First Neural NetworkMatplotlib - MultiplotsMatplotlib - Quiver PlotPython - Chunks and Chinks View More
Top Discussion
How can I write Python code to change a date string from "mm/dd/yy hh: mm" format to "YYYY-MM-DD HH: mm" format? Which sorting technique is used by sort() and sorted() functions of python? How to use Enum in python? Can you please help me with this error? I was just selecting some random columns from the diabetes dataset of sklearn. Decision tree is a classification algo...How can it be applied to load diabetes dataset which has DV continuous Objects in Python are mutable or immutable? How can unclassified data in a dataset be effectively managed when utilizing a decision tree-based classification model in Python? How to leave/exit/deactivate a Python virtualenvironment Join Discussion
Top Courses
Webinars
Top 10 Basic Datascience Interview Questions and Answers for 2020

Shashank Shanu
2 years ago

Table of Content
Question 1. Describe Univariate, Bivariate and Multivariate Analysis.?
Question 2. What Do You Understand by The Term Normal Distribution?
Question 3. What Is Linear Regression?
Question 4. What is R square?
Question 5. What is the difference between Supervised learning, Unsupervised learning and Reinforcement learning?
Question 6. What is Mean Square Error?
Question 7: What is the difference between logistic and linear regression?
Question 8. How to handle a decision tree for numerical and categorical data?
Question 9: During analysis, how do you treat missing values?
Question 10: Why data cleaning plays a vital role in the analysis?
After
months and year of your learning, one of the most important part of your Data
science journey is the interview process. Interviews are very rigorous process where the candidates are
judged on different areas of expertise such technical and coding skills,
knowledge and clarity of basic concepts of data science, statistics, machine
learning and many more. If you willing to apply for data science jobs, it is very
important to know what kind of interview questions generally interviewers, recruiters
and hiring managers may ask.
So, in this article, I
will try to give top 10 questions which may be asked by an interviewer during
your interview process.
So, without wasting much
time, let’s start…
Question 1. Describe Univariate, Bivariate and Multivariate Analysis.?

Answer: These are the types of analysis
methodologies having a single, double, multiple variables.
Univariate
analysis is a type of analysis which will have one variable and due to this
there are no relationships, causes. Univariate analysis is mostly used to
summarize the data and find the patterns within it to make actionable
decisions.
A Bivariate
analysis is a type of analysis which deals with the relationship between two variables.
These sets of paired variables come from related sources, or samples. The
strength of the correlation between the two variables will be tested using
Bivariate analysis.
A
multivariate analysis is a type of analysis where we try to find the
relationships between more than two variables. In real world this is the most
important and used type of analysis.
Question 2. What Do You Understand by The Term Normal Distribution?
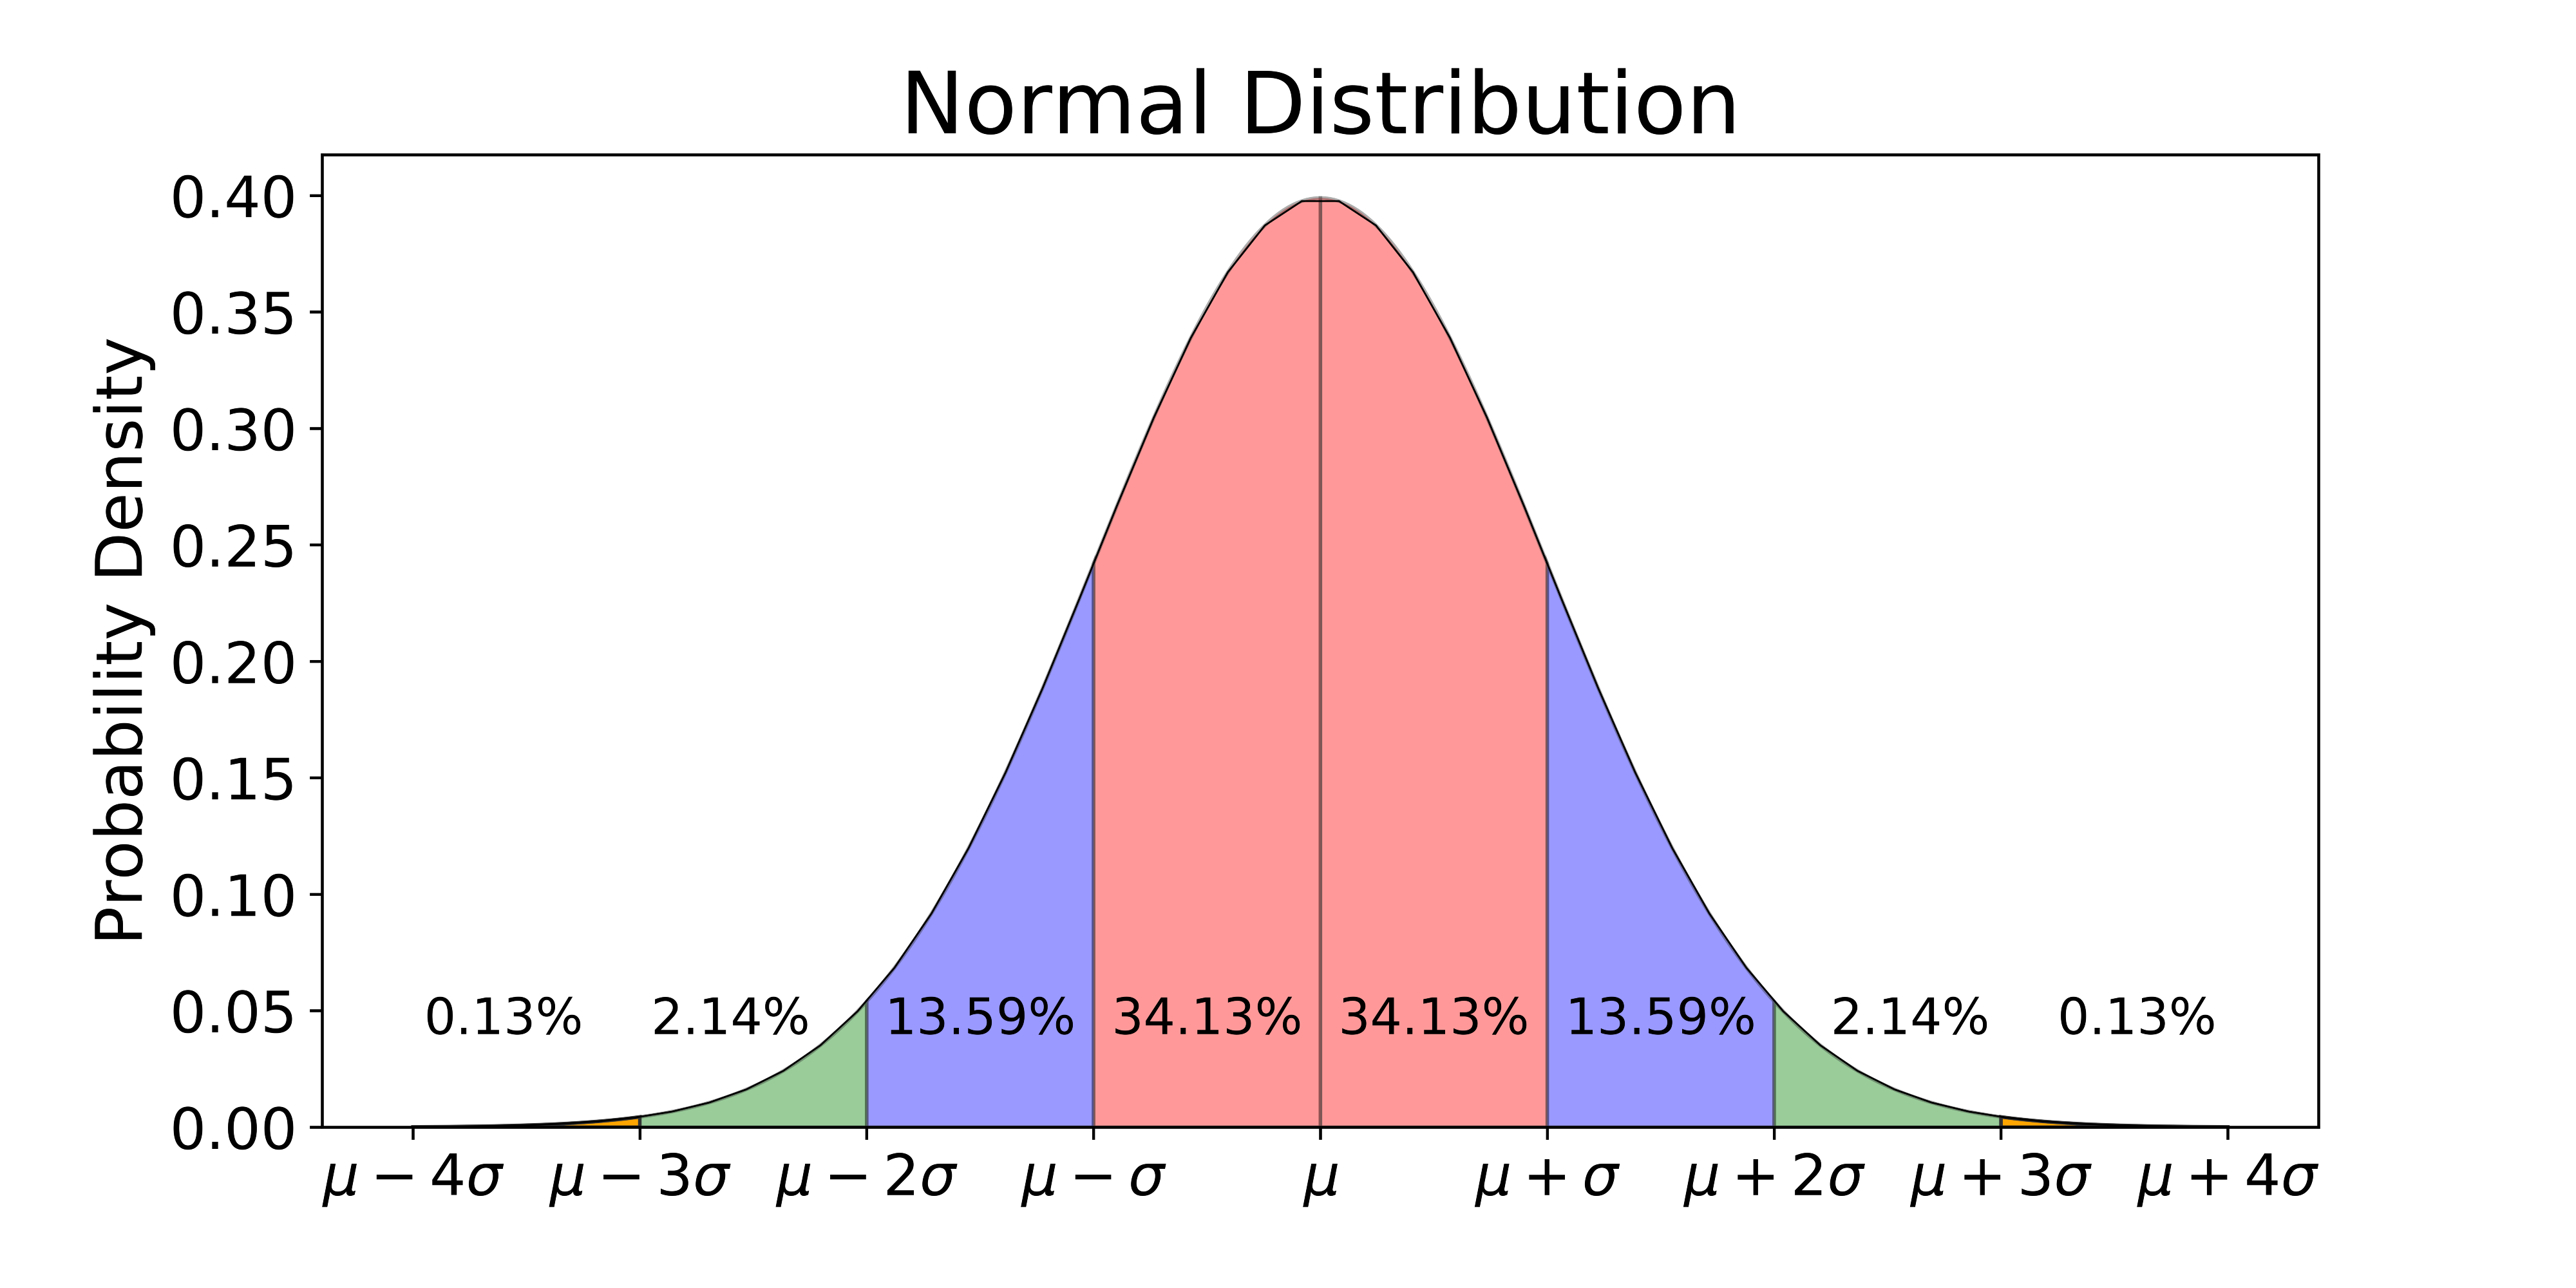
Answer: Normal distribution is a type of
continues probability. It is a set of continuous variables spread across a
normal curve or in the shape of a bell curve. It is the most commonly used distribution
curve and very useful to analyze the variables and their relationships when we
have the normal distribution curve.
The normal
distribution curve is symmetrical. The non-normal distribution also tries to
become normal distribution as the size of the samples increases this is known
as Central Limit Theorem. It is also very easy to apply the Central Limit
Theorem. This method helps to make sense of data that is random by creating an
order and interpreting the results using a bell-shaped graph.
Question 3. What Is Linear Regression?
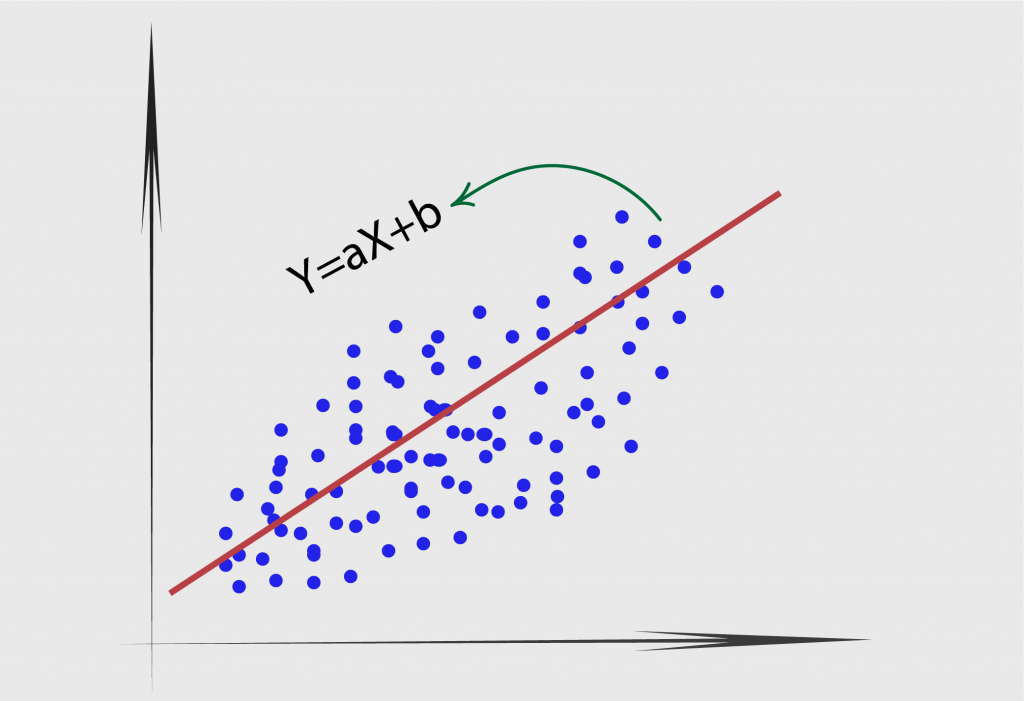
Answer: It is one the most commonly used algorithm
for predictive analytics. Linear Regression is used to find relationship
between a dependent variable and one or more independent variable. The main
task in the Linear Regression is the method of fitting a single line within a
scatter plot.
The Linear
Regression consists of the following three methods:
- Determining and analyzing the correlation and direction of the data.
- Deploying the estimation of the model.
- Ensuring the usefulness and validity of the model.
It is
extensively used in scenarios where the cause-effect model comes into play. For
example, you want to know the effect of a certain action in order to determine
the various outcomes and extent of the effect the cause has in determining the
final outcome.
Question 4. What is R square?
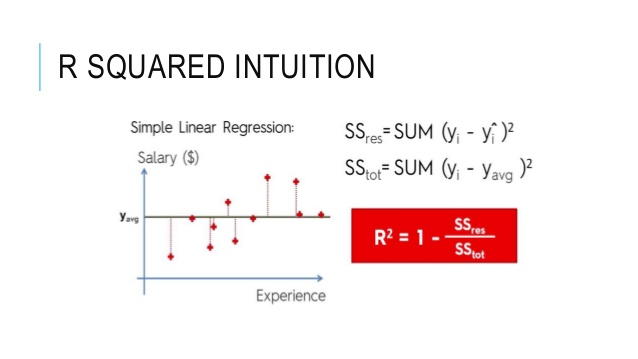
Answer: R-squared is a
statistical measure of how close the data are to the fitted regression line. It
is also known as the coefficient of determination, or the coefficient of
multiple determination for multiple regression.
The definition of
R-squared is the percentage of the response variable variation that is
explained by a linear model.
R-squared = Explained variation / Total variation
R-squared is always
between 0 and 100%.
0% indicates that the
model explains none of the variability of the response data around its mean.
100% indicates that the
model explains all the variability of the response data around its mean.
In general, the higher
the R-squared, the better the model fits your data.
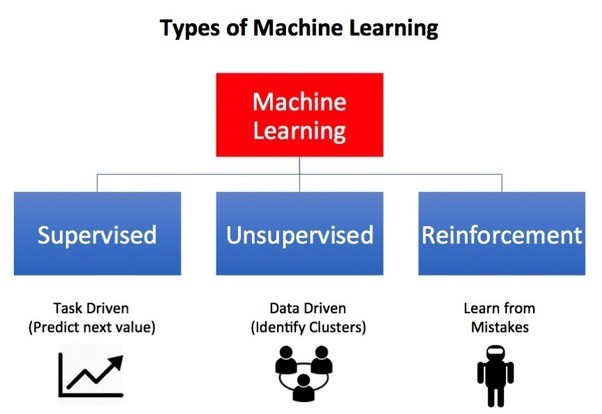
Question 5. What is the difference between Supervised learning, Unsupervised learning and Reinforcement learning?
Answer:
Machine Learning
Machine learning is the
scientific study of algorithms and statistical models that computer systems use
to effectively perform a specific task without using explicit instructions,
relying on patterns and inference instead.
Building a model by
learning the patterns of historical data with some relationship between data to
make a data-driven prediction.
Types of Machine
Learning
- Supervised Learning
- Unsupervised Learning
- Reinforcement Learning
Supervised learning
In a supervised learning
model, the algorithm learns on a labelled dataset, to generate reasonable predictions
for the response to new data. (Forecasting outcome of new data).
- Regression
- Classification
Unsupervised learning
An unsupervised model,
in contrast, provides unlabeled data that the algorithm tries to make sense of
by extracting features, co-occurrence and underlying patterns on its own. We
use unsupervised learning for
- Clustering
- Anomaly detection
- Association
- Autoencoders
Reinforcement Learning
Reinforcement learning
is less supervised and depends on the learning agent in determining the output solutions
by arriving at different possible ways to achieve the best possible solution.
Question 6. What is Mean Square Error?
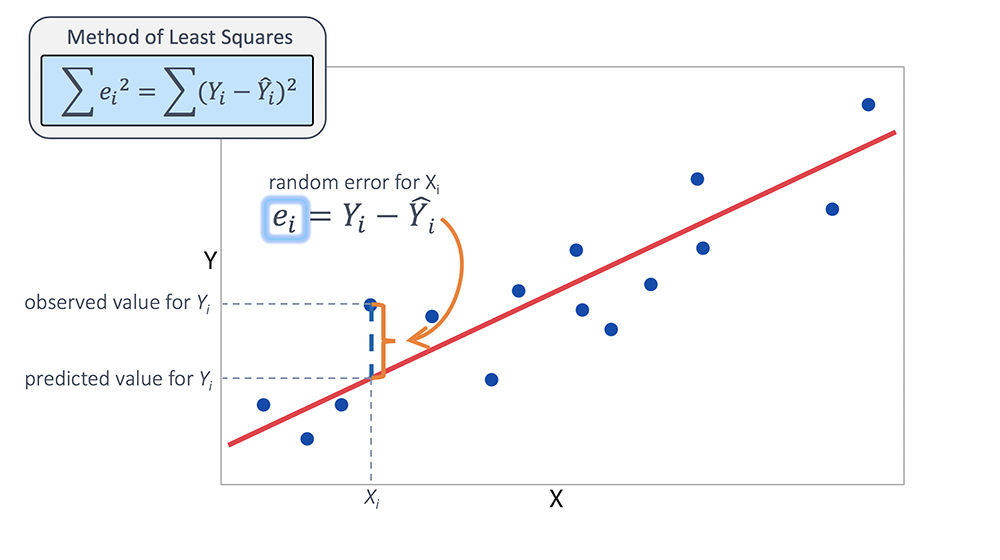
Answer: It is a type of evaluation metric which tells you how close a
regression line is to a set of points. It does this by taking the distances
from the points to the regression line (these distances are the “errors”) and squaring
them.
Question 7: What is the difference between logistic and linear regression?
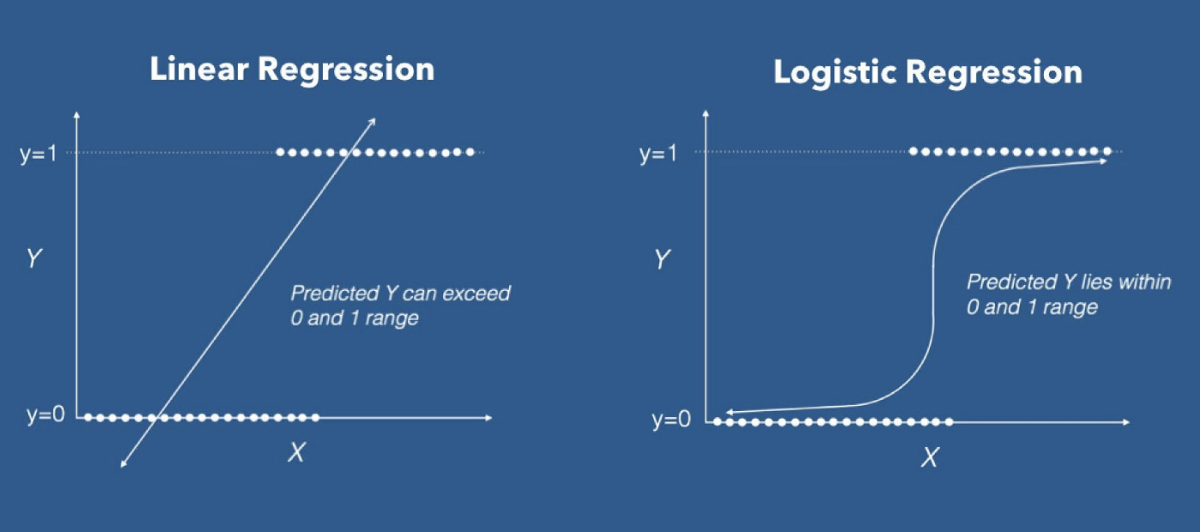
Answer: Linear and Logistic
regression are the most basic form of regression which are commonly used. The
essential difference between these two is that Logistic regression is used when
the dependent variable is binary. In contrast, Linear regression is used when
the dependent variable is continuous, and the nature of the regression line is
linear.
Key Differences between Linear and Logistic Regression
Linear regression models data using continuous numeric value. As
against, logistic regression models the data in the binary values.
Linear regression requires to establish the linear relationship
among dependent and independent variables, whereas it is not necessary for
logistic regression.
In linear regression, the independent
variable can be correlated with each other. On the contrary, in the logistic
regression, the variable must not be correlated with each other.
Question 8. How to handle a decision tree for numerical and categorical data?
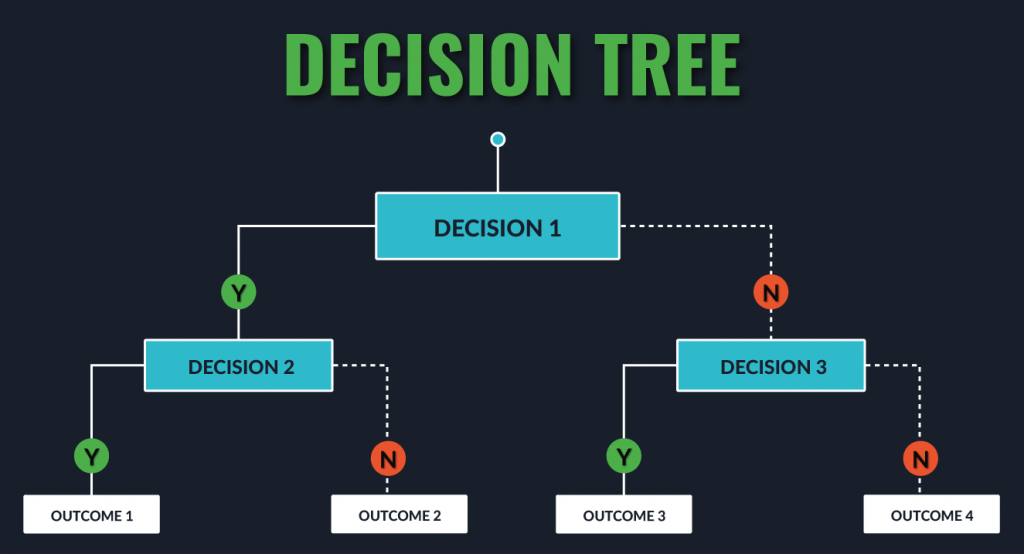
Answer: Decision trees can handle both categorical and numerical variables
at the same time as features. There is not any problem in doing that.
Every split in a decision tree is based on a feature.
1. If the feature is
categorical, the split is done with the elements belonging to a particular
class.
2. If the feature is continuous, the split is done with the
elements higher than a threshold.
At every split, the decision tree will take the best variable at
that moment. This will be done according to an impurity measure with the split
branches. And the fact that the variable used to do split is categorical or
continuous is irrelevant (in fact, decision trees categorize continuous
variables by creating binary regions with the threshold).
At last, the good approach is to
always convert your categoricals to continuous using LabelEncoder or
OneHotEncoding.
Question 9: During analysis, how do you treat missing values?
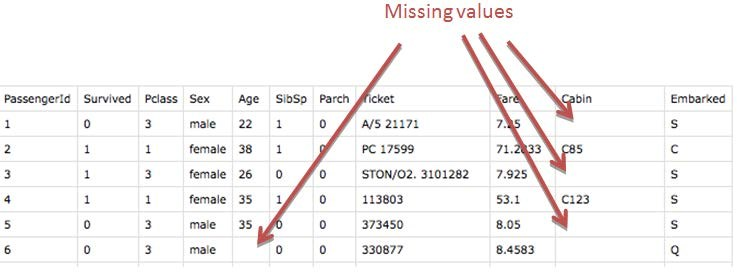
Answer: The extent of
the missing values is identified after identifying the variables with missing
values. If any patterns are identified the analyst has to concentrate on them
as it could lead to interesting and meaningful business insights. If there are no
patterns identified, then the missing values can be substituted with mean or median
values (imputation) or they can simply be ignored. There are various factors to
be considered when answering this question-
Understand
the problem statement, understand the data and then give the
answer.
Assigning a default value which can be mean, minimum or maximum
value.
Getting into the data is important.
If
it is a categorical variable, the default value is assigned. The missing value is
assigned a default value.
If
you have a distribution of data coming, for normal distribution give the mean
value.
Should
we even treat missing values is another important point to consider? If 80% of
the values for a variable are missing then you can answer that you would be
dropping the variable instead of treating the missing values.
Question 10: Why data cleaning plays a vital role in the analysis?
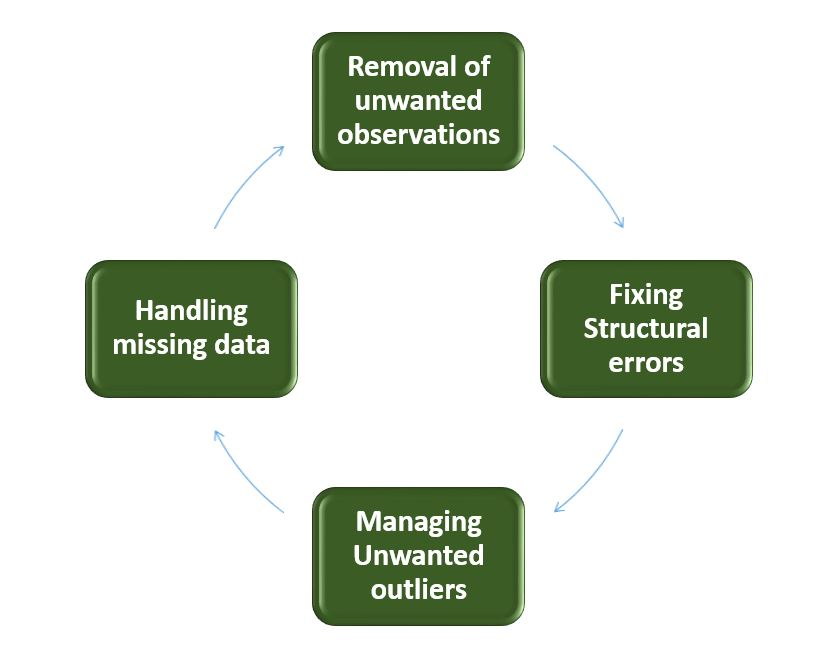
Answer: Cleaning data
from multiple sources to transform it into a format that data analysts or data
scientists can work with is a cumbersome process because – as the number of
data sources increases, the time take to clean the data increases exponentially
due to the number of sources and the volume of data generated in these sources.
It might take up to 80% of the time for just cleaning data making it a critical
part of analysis task.
These
are some of the most common interviews questions and answers which is being
asked most frequently by an interviewer. But there are lots of area where an
interviewer may ask question. So, it’s very important for you to be well
prepared before facing an interview round.
I hope after you enjoyed reading this article and finally, later
I will try to bring some more interesting and important questions of data
science interviews.
For more such blogs/courses on data science, machine
learning, artificial intelligence and emerging new technologies do visit us at InsideAIML.
Thanks for reading…
Happy Learning…