Download our e-book of Introduction To Python
Related Blog
Matplotlib - Subplot2grid() FunctionDiscuss Microsoft Cognitive ToolkitMatplotlib - Working with ImagesMatplotlib - PyLab moduleMatplotlib - Working With TextMatplotlib - Setting Ticks and Tick LabelsCNTK - Creating First Neural NetworkMatplotlib - MultiplotsMatplotlib - Quiver PlotPython - Chunks and Chinks View More
Top Discussion
How can I write Python code to change a date string from "mm/dd/yy hh: mm" format to "YYYY-MM-DD HH: mm" format? Which sorting technique is used by sort() and sorted() functions of python? How to use Enum in python? Can you please help me with this error? I was just selecting some random columns from the diabetes dataset of sklearn. Decision tree is a classification algo...How can it be applied to load diabetes dataset which has DV continuous Objects in Python are mutable or immutable? How can unclassified data in a dataset be effectively managed when utilizing a decision tree-based classification model in Python? How to leave/exit/deactivate a Python virtualenvironment Join Discussion
Top Courses
Webinars
Support Vector Machine

Shashank Shanu
3 years ago

Table of Content
- What is Support Vector Machine?
- Why we Need SVMs?
- Kernel in SVMs
- A simple implementation of SVM in Python
Most of already know one
of the most prevailing and exciting supervised learning models with associated
learning algorithms that analyses data and recognize patterns is Support
Vector Machines (SVMs).
SVMs can be used for
solving both regression and classification problems. However, it is mostly used
in solving classification problems. SVMs were first introduced by B.E. Boser et
al. in 1992 and has become popular due to huge success in handwritten digit
recognition in 1994.
Before the emergence of
Boosting Algorithms, for example, XGBoost and AdaBoost, SVMs had been commonly
used.
If you want to have a
consolidated foundation of Machine Learning algorithms, you should definitely know
this algorithm. SVMs is a powerful algorithm, but the concepts behind are also
not as complicated as you may be thinking.
What is Support Vector Machine?
SVM comes under a supervised machine
learning algorithm. It can also be used for classifications as well as
regression problems.
In
the SVMs algorithm, we try to plot each data points as a point in n-dimensional
space (where n is a number of features) with the value of each feature representing
the value of a particular coordinate. Then, we perform classification by
finding the hyper-plane that differentiates the two classes very well as shown
in the below image.
Why we Need SVMs?
The Logistic
Regression algorithm doesn’t care about whether the instances are close to the
decision boundary or not. So, the decision boundary it tries to pick may not be
optimal. As we can see from the above image, if a point is far from the
decision boundary, we may be more confident about our predictions that it
classifies right class. So, the aim of the optimal decision boundary should be
able to maximize the distance between the decision boundary and all other
instances. i.e., maximize the margins.
That’s why the
Support Vector algorithm is important and we need it, most of the time as it
produces better results.
The main aim of applying SVMs is
to find the best line in two dimensions or the best hyperplane in more than two
dimensions in order to help us separate our space into classes. The hyperplane
(line) is found through the maximum margin, i.e.,
the maximum distance between data points of both classes.
We will be taking an
example to understand it
Support Vector Machines
Imagine we are having
the labelled training set are two classes of data points (two dimensions):
Alice and Cinderella. As we can see to separate these two classes, there are so
many possible options of hyperplanes that separate them correctly. As shown in
the image below, we can achieve exactly the same result using different
hyperplanes (L1, L2, L3). But, if we try to add new data points, the
consequence of using various hyperplanes will be very different in terms of
classifying new data point into the right group of class.
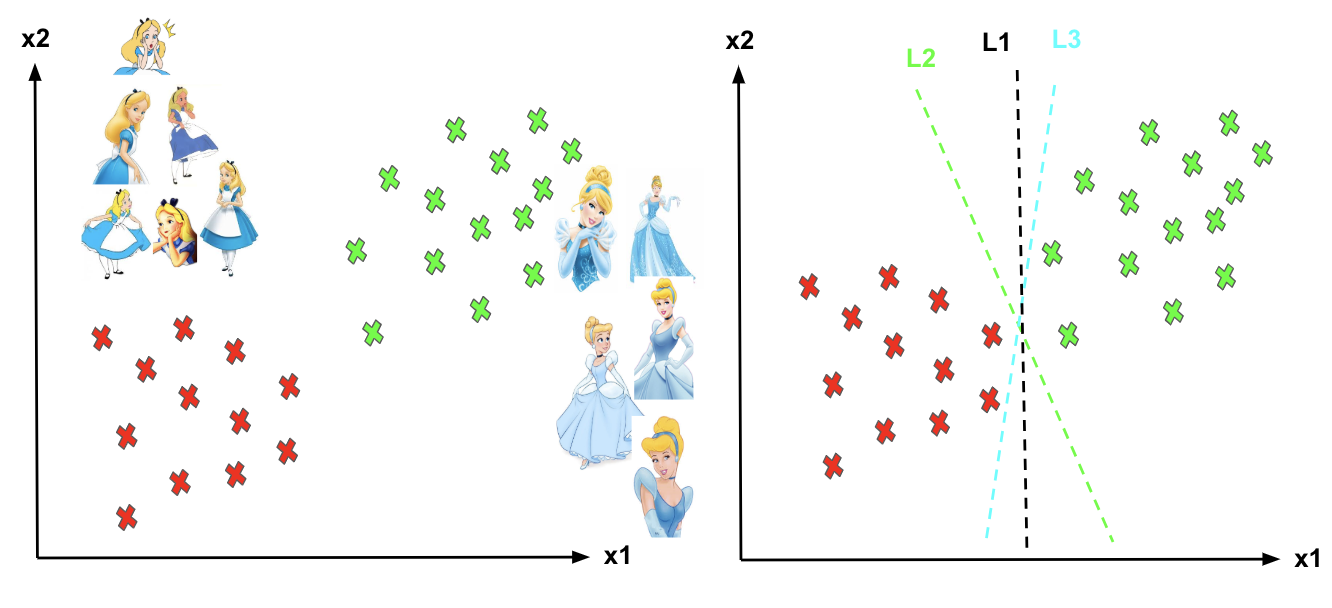
Now you
may be thinking that then how can we decide a separating line for the
classes and Which hyperplane shall we use? Let’s see the below image and
try to understand it.
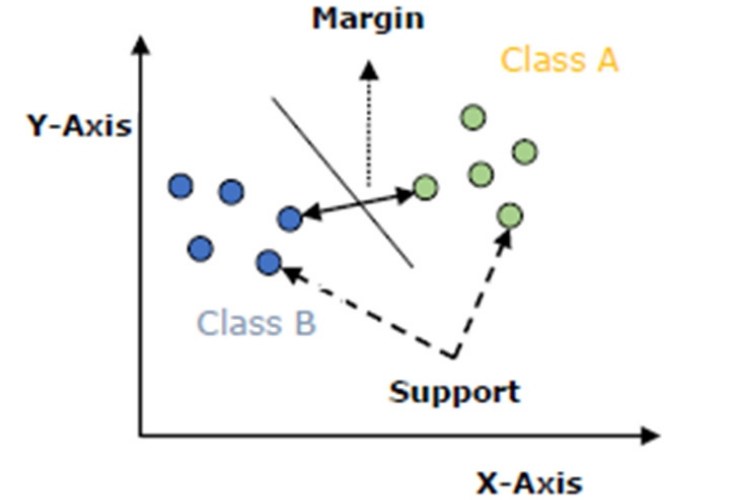
Some of the most important
terminologies of SVMs are mentioned below-
- Support Vector
- Hyperplane
- Margin
The vector points which are closest
to the hyperplane are known as support vector points because only
these two points are contributing to the result of the algorithm, and other
points are not.
If a data point is not a
support vector so removing that data points has no effect on the model. But if
we delete the support vectors points it will then lead to change the position
of the hyperplane which will affect the result.
Note: The dimension of
the hyperplane will depend upon the number of features is present. If the
number of input features is 2, then the hyperplane will be just a line and if
the number of input features is 3, then the hyperplane becomes a 2D plane. It
becomes difficult to imagine when the number of features becomes more than 3.
The distance of the vectors from
the hyperplane is called the margin, which is
a separation of a line to the closest class points. We would like to choose a
hyperplane that maximizes the margin between classes. The image below shows
what good margin and bad margin are.

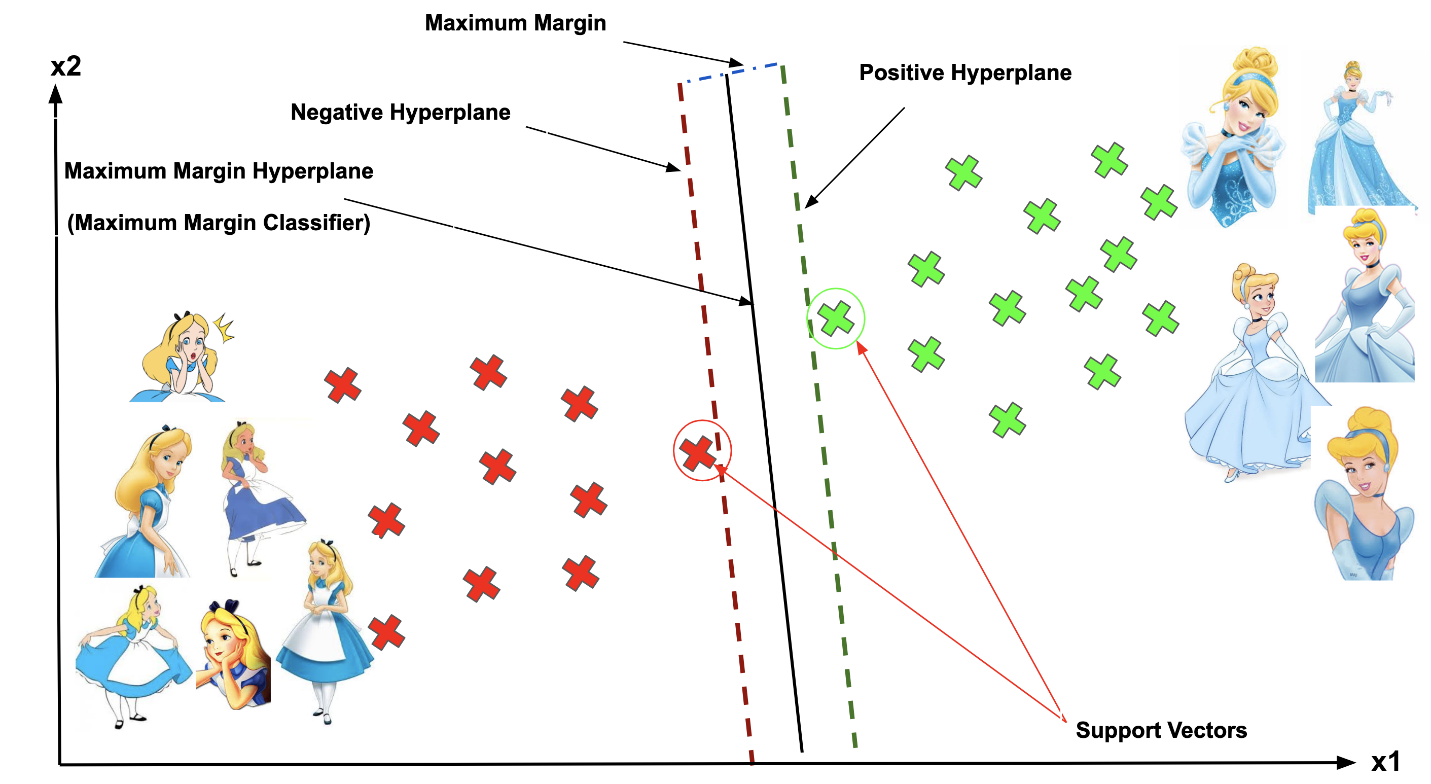
The
objective of the SVM algorithm is to divide the datasets into different classes
and to find a maximum marginal hyperplane (MMH) which can be done as follows−
- SVMs will generate hyperplanes iteratively that segregates the classes in the best possible way.
- Then, it will choose the hyperplane that separates the classes correctly.
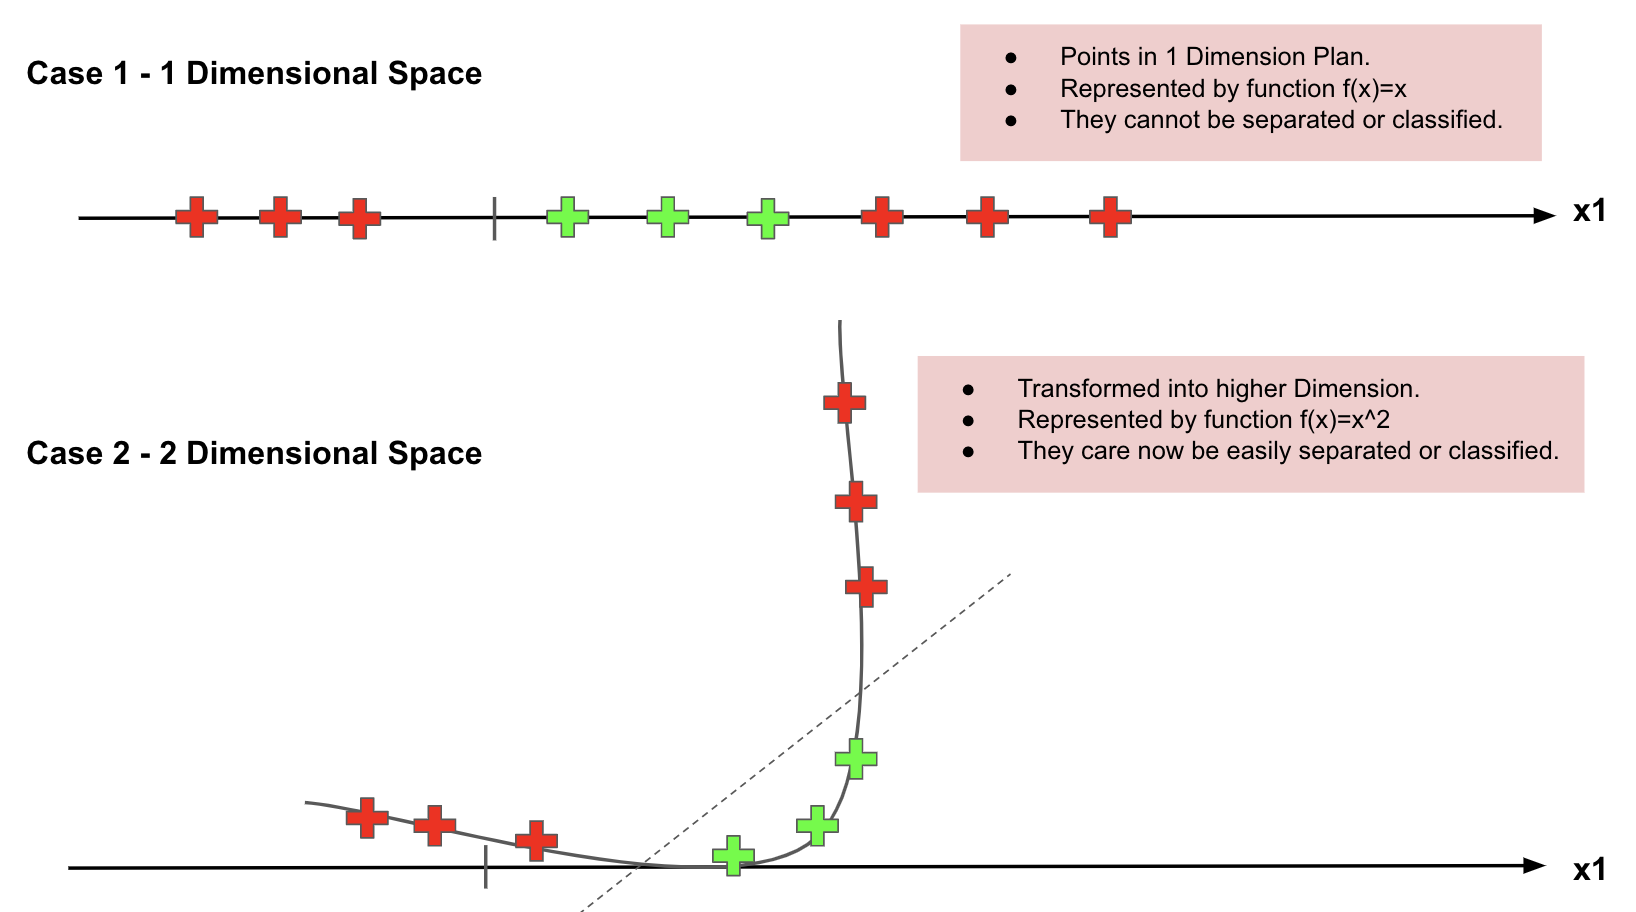
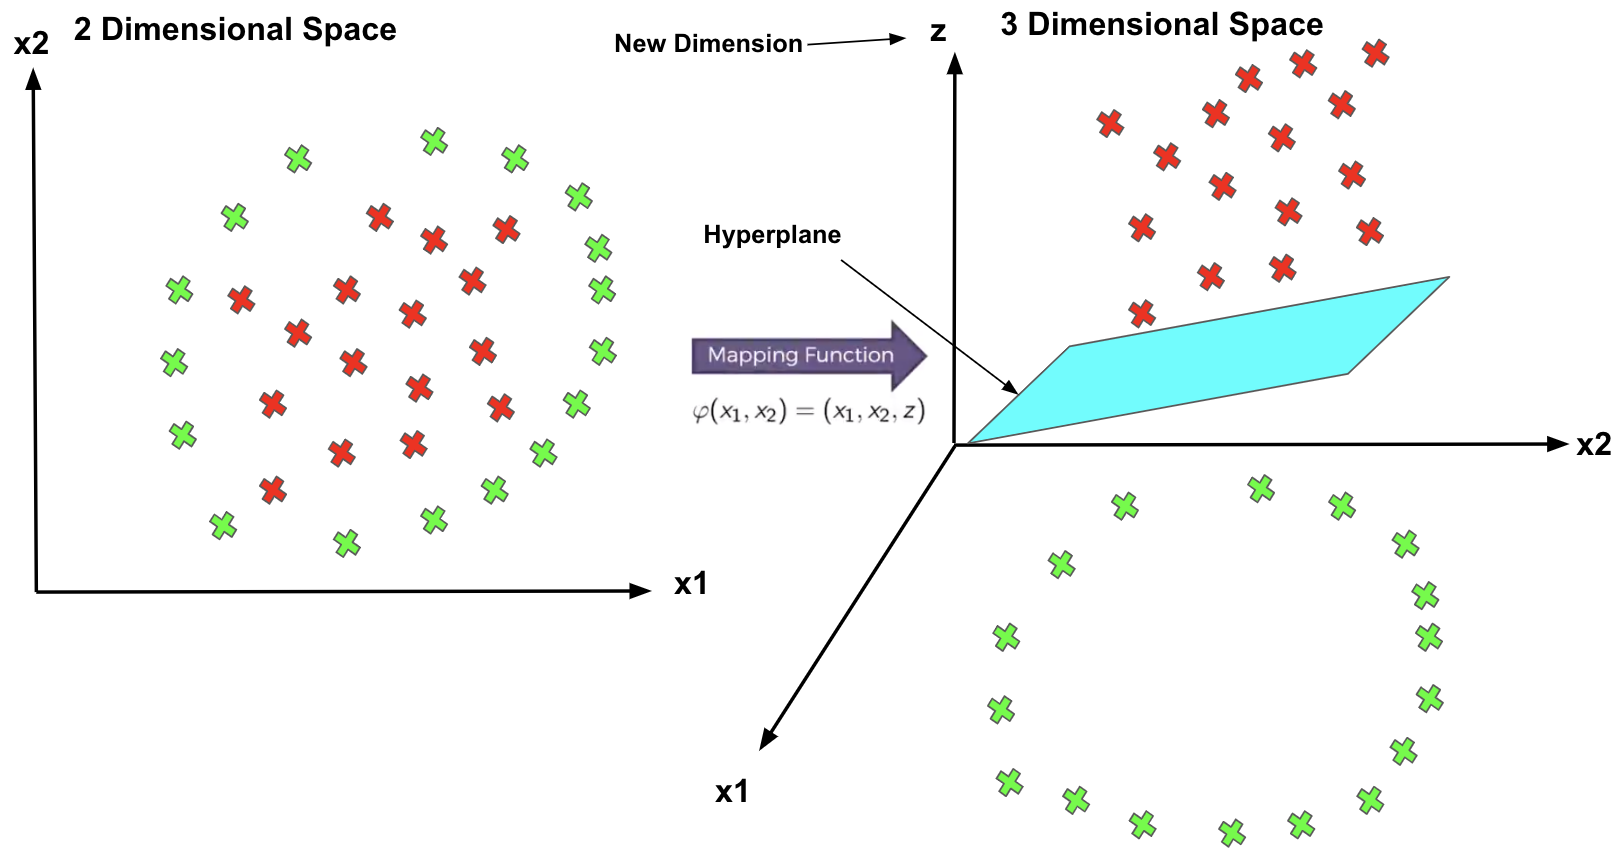
Kernel in SVMs
SVMs algorithm has a technique called the kernel trick. These are functions which take low dimensional input
space and transform it into a higher-dimensional space, i.e., it converts not
separable problem to separable problem. It is mostly useful in non-linear
separation problems.
How to map lower dimension to a
Higher Dimension?
You will understand it better with the below image.
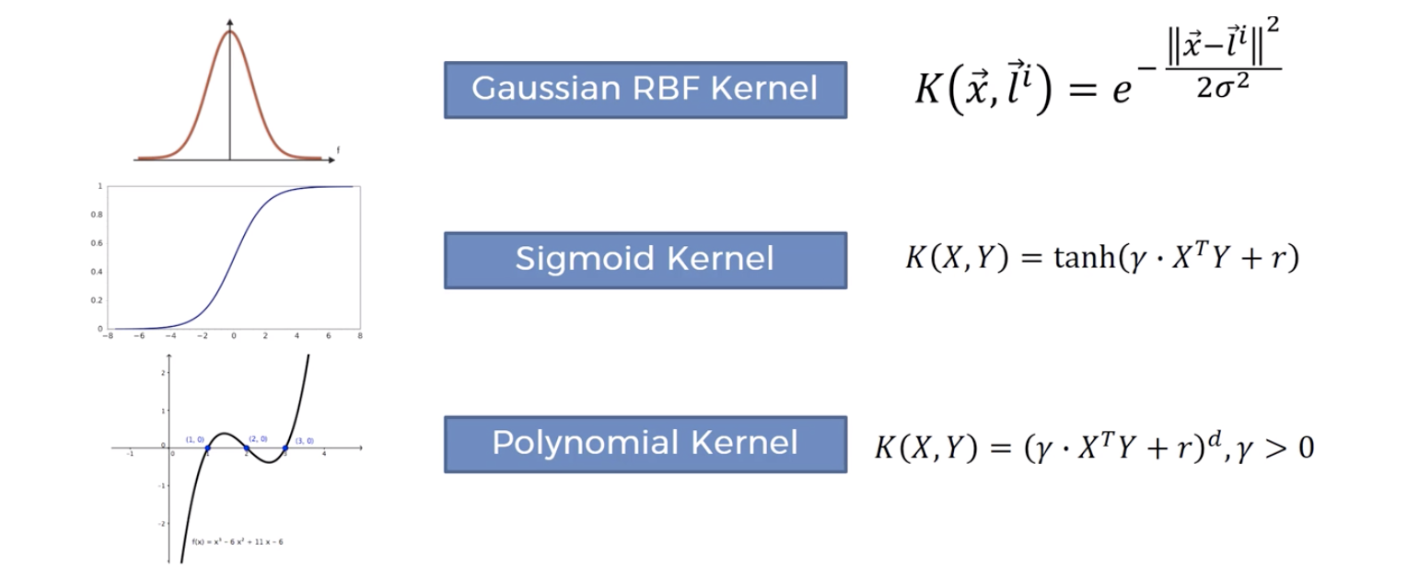
Some of the most frequently used kernels are shown in the image-
A simple implementation of SVM in Python
# Import libraries

import pandas as pd
import numpy as np
from sklearn import svm, datasets
import matplotlib.pyplot as plt

# Loading Iris Dataset

iris_data = datasets.load_iris()

# Dependent and independent dataset.

X = iris_data.data[:, :2]
y = iris_data.target

#Now we will plot the SVM boundaries with original data

x_min, x_max = X[:, 0].min() - 1, X[:, 0].max() + 1
y_min, y_max = X[:, 1].min() - 1, X[:, 1].max() + 1
h = (x_max / x_min)/100
xx, yy = np.meshgrid(np.arange(x_min, x_max, h), np.arange(y_min, y_max, h))
X_plot = np.c_[xx.ravel(), yy.ravel()]

# Providing the value of regularization parameter

C = 1.0

# Creating SVM classifier object

svc_classifier = svm.SVC(kernel='linear', C=C).fit(X, y)

#plotting svm with linear kernel

cf = svc_classifier.predict(X_plot)
cf = cf.reshape(xx.shape)
plt.figure(figsize=(15, 5))
plt.subplot(121)
plt.contourf(xx, yy, cf, cmap=plt.cm.tab10, alpha=0.3)
plt.scatter(X[:, 0], X[:, 1], c=y, cmap=plt.cm.Set1)
plt.xlabel('Sepal length')
plt.ylabel('Sepal width')
plt.xlim(xx.min(), xx.max())
plt.title('Support Vector Classifier with linear kernel')

I hope you enjoyed reading this article and finally, you came
to know about the Support Vector Machine(SVM) algorithm, also you got to know how you can implement it using python.
For more such blogs/courses on data science, machine
learning, artificial intelligence and emerging new technologies do visit us at InsideAIML.
Thanks for reading…
Happy Learning…