Download our e-book of Introduction To Python
Related Blog
Matplotlib - Subplot2grid() FunctionDiscuss Microsoft Cognitive ToolkitMatplotlib - Working with ImagesMatplotlib - PyLab moduleMatplotlib - Working With TextMatplotlib - Setting Ticks and Tick LabelsCNTK - Creating First Neural NetworkMatplotlib - MultiplotsMatplotlib - Quiver PlotPython - Chunks and Chinks View More
Top Discussion
How can I write Python code to change a date string from "mm/dd/yy hh: mm" format to "YYYY-MM-DD HH: mm" format? Which sorting technique is used by sort() and sorted() functions of python? How to use Enum in python? Can you please help me with this error? I was just selecting some random columns from the diabetes dataset of sklearn. Decision tree is a classification algo...How can it be applied to load diabetes dataset which has DV continuous Objects in Python are mutable or immutable? How can unclassified data in a dataset be effectively managed when utilizing a decision tree-based classification model in Python? How to leave/exit/deactivate a Python virtualenvironment Join Discussion
Top Courses
Webinars
Violin plots

Sahil Parrvez
2 years ago

Table of Contents
- Introduction
- Make a violin plot
- Violin Plot Basic Example
Introduction
Violin plots are similar to box plots, but they also show at different values ,the probability density of data.A marker for the median of the data and a box indicating the interquartile range are included in these plots, as in the standard box plots. Overlaid on this box plot is a kernel density estimation. It used to represent comparison of a variable distribution (or sample distribution) across different "categories".
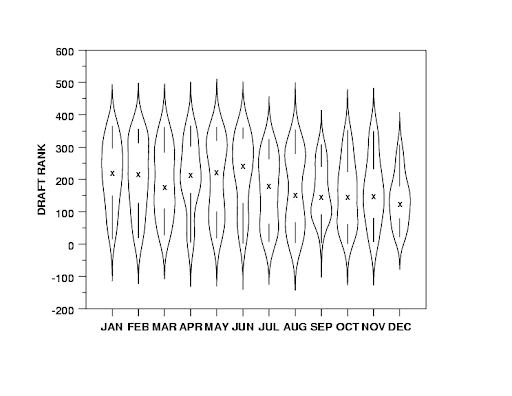
A violin plot is more informative than a plain box plot. In fact while a box plot only shows summary statistics such as mean/median and interquartile ranges, the violin plot shows the full distribution of the data.
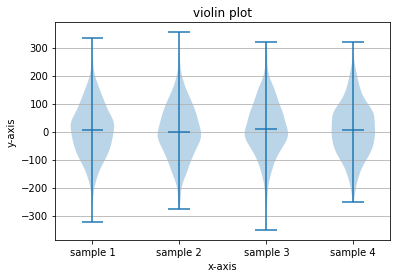
Make a violin plot
Create a violin diagram for each column in the data set or each vector in the sequence data set. Each filled area is stretched to represent the entire range of data, with optional lines at the mean, median, minimum, maximum, and custom quantiles.
matplotlib.pyplot.violinplot(dataset, positions=None, vert=True, widths=0.5, showmeans=False, showextrema=True, showmedians=False, quantiles=None, points=100, bw_method=None, *, data=None)
Parameters :
- dataset : Array or a sequence of vectors.
The input data.
- positions : array-like, default: [1, 2, ..., n]
The positions of the violins. The ticks and limits are automatically set to match the positions.
- vert : bool, default: True.
If true, creates a vertical violin plot. Otherwise, creates a horizontal violin plot.
- width : sarray-like, default: 0.5
Either a scalar or a vector that sets the maximal width of each violin. The default is 0.5, which uses about half of the available horizontal space.
- showmeans : bool, default: False
If True, will toggle rendering of the means.
- showextrema : bool, default: True
If True, will toggle rendering of the extrema.
- showmedians : bool, default: False
If True, will toggle rendering of the medians.
- quantiles : array-like, default: None
If not None, set a list of floats in interval [0, 1] for each violin, which stands for the quantiles that will be rendered for that violin.
- points : int, default: 100
Defines the number of points to evaluate each of the gaussian kernel density estimations at.
- bw_method : str, scalar or callable, optional
The method used to calculate the estimator bandwidth. This can be 'scott', 'silverman', a scalar constant or a callable. If a scalar, this will be used directly as kde.factor. If a callable, it should
take a GaussianKDE instance as its only parameter and return a scalar. If None (default), 'scott' is used.
- data : indexable object, optional
If given, the following parameters also accept a string s, which is interpreted as data[s] (unless this raises an exception):
dataset
Returns
dict
A dictionary mapping each component of the violinplot to a list of the corresponding collection instances created. The dictionary has the following keys:
- bodies : A list of the PolyCollection instances containing the filled area of each violin.
- cmeans : A LineCollection instance that marks the mean values of each of the violin's distribution.
- cmins : A LineCollection instance that marks the bottom of each violin's distribution.
- cmaxes : A LineCollection instance that marks the top of each violin's distribution.
- cbars : A LineCollection instance that marks the centers of each violin's distribution.
- cmedians : A LineCollection instance that marks the median values of each of the violin's distribution.
- cquantiles : A LineCollection instance created to identify the quantile values of each of the violin's distribution.
Violin Plot Basic Example:
import numpy as np
import matplotlib.pyplot as plt

# generate some random data
sample1= np.random.normal(5, 90, 1000)
sample2= np.random.normal(5, 95, 1000)
sample3= np.random.normal(5, 100, 1000)
sample4= np.random.normal(5, 95, 1000)
sample= list([sample1, sample2, sample3, sample4])


fig, ax = plt.subplots()


# build a violin plot
ax.violinplot(sample, showmeans=False, showmedians=True)


# add title and axis labels
ax.set_title('violin plot')
ax.set_xlabel('x-axis')
ax.set_ylabel('y-axis')


# add x-tick labels
xticklabels = ['sample 1', 'sample 2', 'sample 3', 'sample 4']
ax.set_xticks([1,2,3,4])
ax.set_xticklabels(xticklabels)


# add horizontal grid lines
ax.yaxis.grid(True)


# show the plot
plt.show()
Output
Like the Blog, then Share it with your friends and colleagues to make this AI community stronger.
To learn more about nuances of Artificial Intelligence, Python Programming, Deep Learning, Data Science and Machine Learning, visit our insideAIML blog page.
Keep Learning. Keep Growing.